

Think the scale tells the whole story? It doesn’t.
Lifting often swaps fat for muscle, so your weight can sit still while your body reshapes.
In this post you’ll learn a simple, practical plan: start with clear baselines, scale, tape measurements, photos, and a training log, then measure the same way every few weeks.
Combine at least two tracking tools and read the pattern across them, not a single number.
Do that and you’ll know if you’re gaining muscle, losing fat, or recomposing.
Core Methods to Track Body Composition Changes During Strength Training

You’ll get the clearest picture when you combine at least two tracking tools that catch different signals. Just watching the scale won’t tell you much, because lifting often swaps fat for muscle at similar rates. Your weight can stay put for weeks while your body reshapes completely. You need metrics that separate muscle from fat and show you where those changes are happening.
Start with a baseline: body weight, waist and hip measurements, and one set of progress photos. Then measure every few weeks using the same tools under identical conditions. The overlap gives you proof. If your waist shrinks while your upper arm grows and your deadlift climbs, you’re gaining muscle and losing fat even when weight hasn’t budged. That’s recomposition, and a single number can’t capture it.
Real changes usually take about six weeks to show up clearly in measurements. Daily or weekly jumps mostly reflect water retention, glycogen storage, and what you ate yesterday. Not actual fat or muscle shifts. Body composition tracking works when you measure consistently and read the pattern across multiple data points instead of freaking out over one number.
The most practical tracking tools:
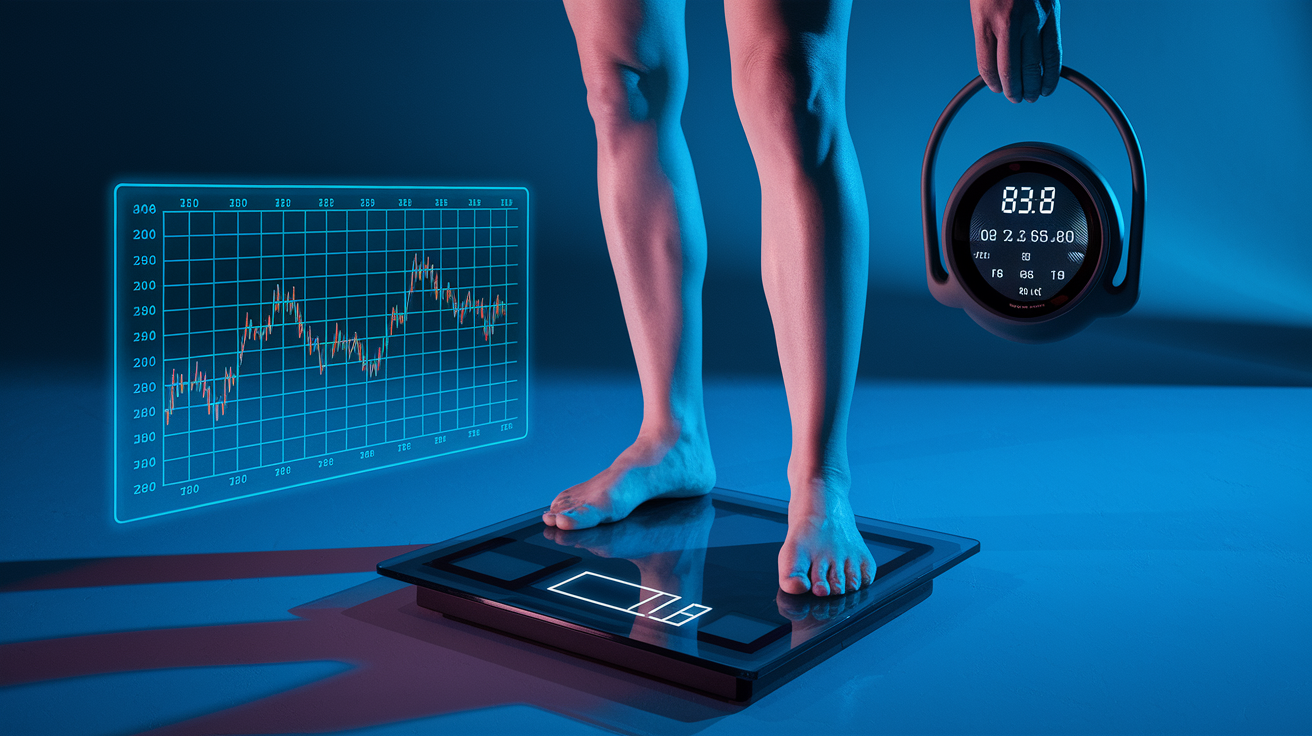
Scale weight tracks total mass trends. Use weekly averages to smooth out daily noise.
Flexible tape measure captures where fat is leaving and muscle is building at your waist, hips, thighs, and upper arms.
Progress photos show visual shape changes that numbers miss. You need consistent lighting, clothing, and camera position or the comparison falls apart.
Training log records weights lifted, reps completed, and performance improvements. Strength gains confirm muscle adaptation.
3D phone scanning apps automate multiple circumference measurements with high consistency if you keep the phone setup identical.
At-home BIA scales estimate body fat percentage but swing with hydration and food. Useful for long term trend direction, not precise weekly changes.
Body Composition Measurements and What They Reveal About Strength Training Progress

Body composition separates your total weight into fat mass and fat free mass. Fat free mass includes skeletal muscle, bone, organs, connective tissue, and water. When you lift, the goal is usually to increase skeletal muscle while holding fat steady or cutting it. Fat free mass can rise from muscle gains, but also from increased hydration or glycogen storage after you start training. Tracking skeletal muscle mass specifically gives you the clearest signal of strength adaptation.
Lean body mass and fat free mass mean nearly the same thing in most consumer devices. Both include muscle, bone, and water. Skeletal muscle mass is the portion that contracts and grows from training. Changes in skeletal muscle happen slowly. Most lifters need eight to twelve weeks of consistent progressive overload before measurable increases show up on a scan or scale.
Visceral fat is the metabolically active fat around your organs. It shows up in waist measurements and appears as a separate line on DEXA scans. Losing visceral fat improves metabolic health and usually happens before subcutaneous fat at the hips or thighs starts dropping.
BMI tells you almost nothing useful when you’re lifting because it treats all mass the same. A lifter with high muscle mass and low body fat often scores as “overweight” on BMI charts. Actual body composition data gives you the information you need to adjust training volume, calories, and protein intake. Skeletal muscle, fat mass, visceral fat, and regional measurements matter. BMI doesn’t.
Key composition metrics and what they reveal:
Skeletal muscle mass confirms muscle growth from resistance training and adequate protein. Rises slowly over months.
Fat mass is total stored fat. Drops during a caloric deficit. May rise slightly during a bulk even when you’re training hard.
Visceral fat is organ surrounding fat linked to metabolic risk. Decreases with consistent waist circumference reductions.
Body fat percentage is the ratio of fat to total mass. Can fall even if fat mass rises, assuming muscle grows faster. Useful for tracking recomposition.
Tracking Body Fat Changes While Lifting Using Tape, Photos, and Calipers
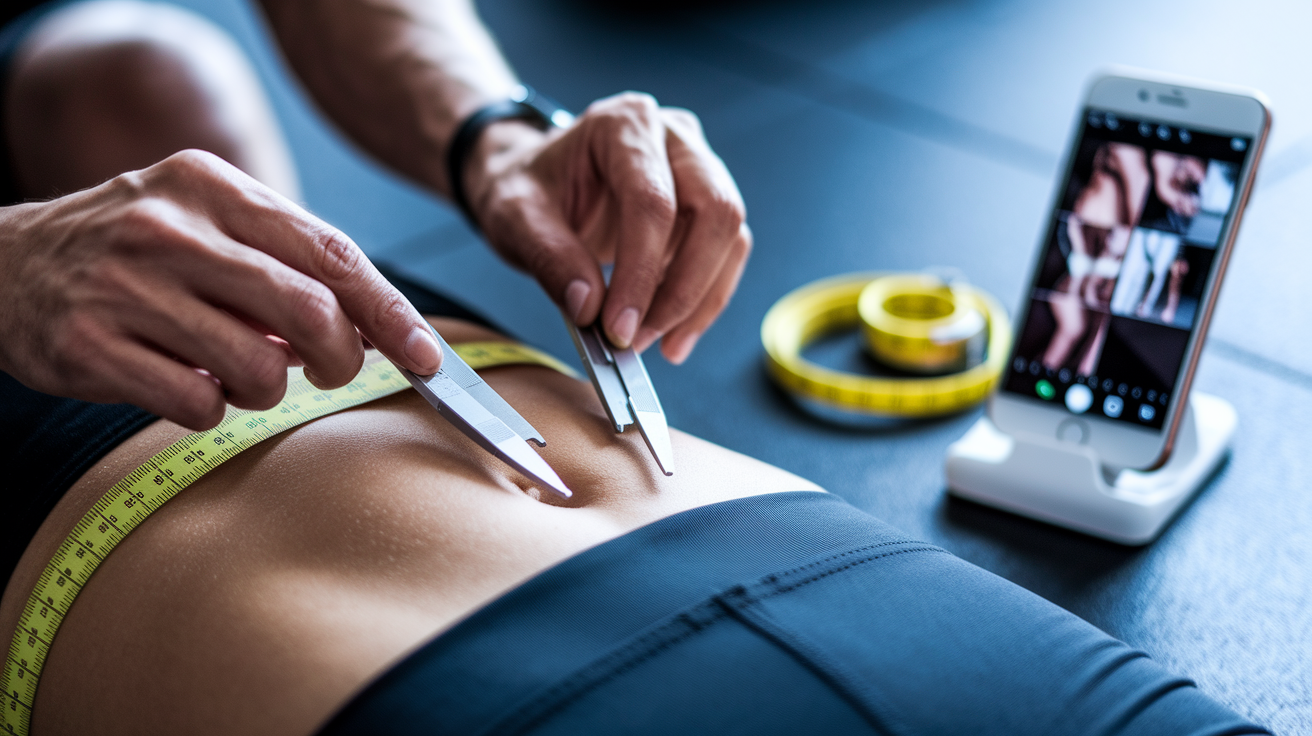
A retractable flexible tape measure is cheap, portable, and gives you direct evidence of where your body is changing. Measure your waist at navel level, hips at the widest point, one thigh mid way between hip and knee, and one upper arm mid way between shoulder and elbow. Record the same limb every time and mark the spot with a pen if you need help finding it again. Pull the tape snug but not tight enough to indent skin.
Circumference measurements track muscle growth in arms and thighs and fat loss around the waist and hips. One of the best low tech ways to track body composition while lifting.
Progress photos reveal shape changes that numbers miss, like improved shoulder definition or a tighter midsection. But only if you control the variables. Wear the same outfit or minimal clothing, stand in the same spot with the same distance from the camera, use identical lighting, and take front, side, and back shots. Set your phone on a small tripod or stack of books at chest height. Morning photos after you wake up and use the bathroom give the most consistent look because hydration and meals haven’t shifted your appearance yet.
Compare photos every two to four weeks instead of daily. Day to day lighting and posture differences create false signals.
Skinfold calipers measure the thickness of a pinched fold of skin and the subcutaneous fat beneath it at specific body sites. A trained assessor using a seven point protocol (chest, triceps, subscapular, midaxillary, suprailiac, abdomen, thigh) can estimate body fat percentage with reasonable accuracy. Self measurement is hard and error prone. Calipers with 1 mm increments and ranges up to 60 or 80 mm are common. If you use calipers, have the same experienced person measure you each time under the same conditions. For solo tracking, tape measurements are more reliable than trying to pinch your own shoulder blade.
| Method | What It Measures | Best Use Case |
|---|---|---|
| Flexible tape measure | Circumferences at waist, hips, thighs, arms | Weekly or biweekly tracking of regional fat loss and muscle growth; simple and consistent |
| Progress photos | Visual body shape, definition, posture | Every 2–4 weeks; reveals changes that numbers miss; requires strict setup consistency |
| Skinfold calipers | Subcutaneous fat thickness at multiple sites | When performed by trained assessor; difficult for self assessment; useful for tracking trends if technique stays identical |
Using Bioelectrical Impedance (BIA) Scales to Track Composition Changes From Strength Training
BIA scales send a low level electrical current through your body and measure resistance. Fat tissue resists current more than muscle and water, so the device estimates body fat percentage using that resistance plus your height, weight, age, and sex. Most at home BIA scales cost between thirty and fifty dollars and report weight in 0.2 lb increments and body fat in 0.1% increments. Some models include hand and foot electrodes for segmental readings (arms, legs, trunk), while simpler versions use only foot electrodes. Features like four user profiles and ninety day storage let multiple people track trends over time.
The catch? Hydration, recent food, exercise, alcohol, and even skin temperature all change your body’s electrical resistance and shift the reading. Drink an extra liter of water or finish a carb heavy meal and your body fat estimate may drop a full percentage point because water conducts current better. Skip hydration for a day and the number climbs. Each manufacturer uses a proprietary equation to convert resistance into body fat percentage, and those equations vary widely in accuracy. One scale might read 18% while another reads 22% on the same person.
BIA is most useful for spotting long term trends over three to six months rather than week to week changes. If your scale consistently shows your body fat estimate dropping over several months while your strength and muscle circumferences rise, that’s a useful signal even if the absolute number isn’t lab accurate. Use BIA as one piece of evidence alongside tape measurements and performance. Not as your single source of truth.
Factors that affect BIA readings and how to manage them:
Hydration status. Drink consistent amounts of water daily and measure at the same hydration level each time. Avoid testing after heavy sweating or intentional dehydration.
Food and caffeine intake. Test in a fasted state or at least three hours after eating. Food shifts fluid distribution and glycogen levels.
Recent exercise. Skip testing for several hours after lifting or cardio. Blood flow and muscle glycogen change resistance patterns.
Alcohol consumption. Abstain for at least 24 hours before measurement. Alcohol dehydrates and affects conductivity.
Electrode contact and skin condition. Stand on the scale with clean, dry feet. Moisturizers or dirt reduce conductivity and shift readings.
Advanced Body Composition Methods for Lifters: DEXA, Hydrostatic Weighing, and Bod Pod
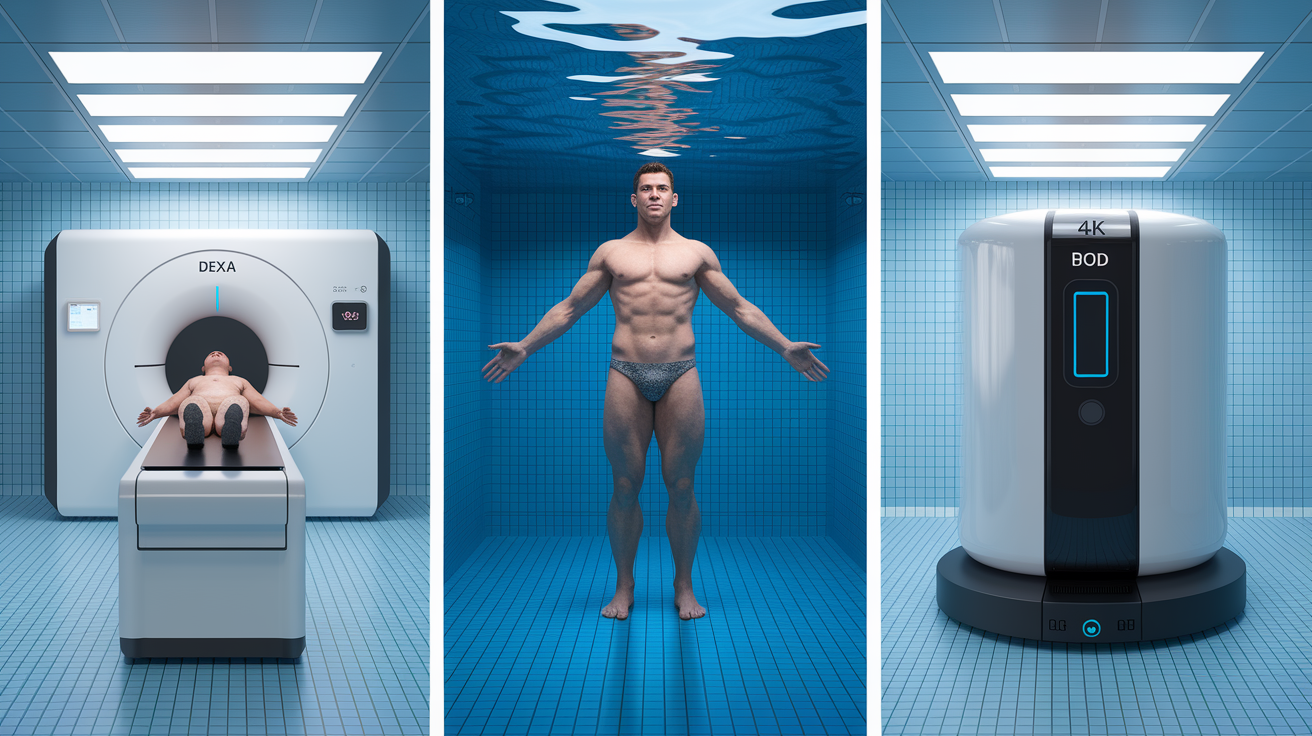
DEXA (dual energy X ray absorptiometry) scans use low dose X rays to separate bone mineral, lean tissue, and fat tissue across your entire body and within regions like your arms, legs, and trunk. A full scan costs around fifty dollars and has a margin of error near 1.6%. DEXA can detect regional muscle differences as small as half a pound, making it the gold standard for tracking whether your left arm is lagging your right or if your legs are growing faster than your upper body. It also reports visceral fat directly, giving you a metabolic health marker that tape and scales miss.
Hydrostatic (underwater) weighing measures body density by comparing your weight on land to your weight fully submerged in water after expelling all air from your lungs. The test costs thirty five to fifty dollars, requires you to repeat the submersion three times, and averages the results to reduce error. Margin of error runs one to three percent when done correctly. The method assumes standard bone and tissue densities, so very muscular or very lean individuals may see slight inaccuracies. But it remains one of the most reliable non imaging options.
The Bod Pod uses air displacement instead of water. You sit in a sealed chamber while it measures the volume of air your body displaces, then calculates body density and estimates body fat percentage. Cost and accuracy are similar to hydrostatic weighing. Forty to fifty dollars per test, one to three percent error. But availability is limited to universities, medical centers, and some private fitness labs. All three advanced methods require appointments and are harder to repeat frequently, so most lifters use them as quarterly benchmarks and track weekly progress with simpler tools.
Accuracy considerations for strength trainees using advanced methods:
DEXA is most detailed. Shows regional muscle and fat changes. Useful for identifying imbalances or tracking recomposition. Repeat every eight to twelve weeks.
Hydrostatic weighing is highly accurate for total body fat. Requires expelling all lung air, which some people find uncomfortable. Less detail on regional distribution.
Bod Pod has similar accuracy to hydrostatic but easier procedure. Limited facility access. Good for quarterly checks.
Cost benefit. Advanced tests are worth the investment every few months to validate trends from at home methods and adjust training or nutrition plans with confidence.
How Strength Performance Metrics Help Distinguish Muscle Gain From Fat Loss

Muscle mass gains almost always show up as strength improvements before they show up clearly on a scale or scan. If your squat, bench press, or deadlift weight climbs while your technique stays consistent, you’re building muscle even if your body weight hasn’t moved. Tracking weights lifted and reps completed in a training log gives you a direct performance signal that confirms muscle adaptation. When you pair rising strength with stable or falling waist circumference, you know you’re in recomposition. Adding muscle and losing fat, even if the scale reads the same number for weeks.
Progressive overload is the core driver of muscle growth, and your log is the proof it’s happening. Record the working weight and reps for key lifts each session. If you hit three sets of five reps at 135 pounds on the bench press one month and three sets of five at 145 pounds the next, that ten pound jump confirms increased force output. Which requires more muscle tissue. Combine that performance data with an increase in upper arm or chest circumference and you have overlapping evidence of muscle gain that no single body composition test can provide as clearly.
Key performance metrics to track for interpreting body composition changes:
Working weights on compound lifts. Squat, deadlift, bench press, overhead press. Rising loads over weeks indicate muscle and strength gains.
Rep and set totals. If you add reps at the same weight (e.g., 3×8 becomes 3×10), you’ve increased total volume and likely built muscle.
One rep max (1RM) or five rep max (5RM). Periodic max testing reveals strength ceiling. Useful every four to eight weeks.
Training volume per week. Sets × reps × weight. Rising volume supports hypertrophy and helps explain circumference increases.
Bodyweight strength ratios. E.g., deadlift as a multiple of body weight. Rising ratios suggest muscle gain or fat loss. Falling ratios may signal excessive calorie deficit.
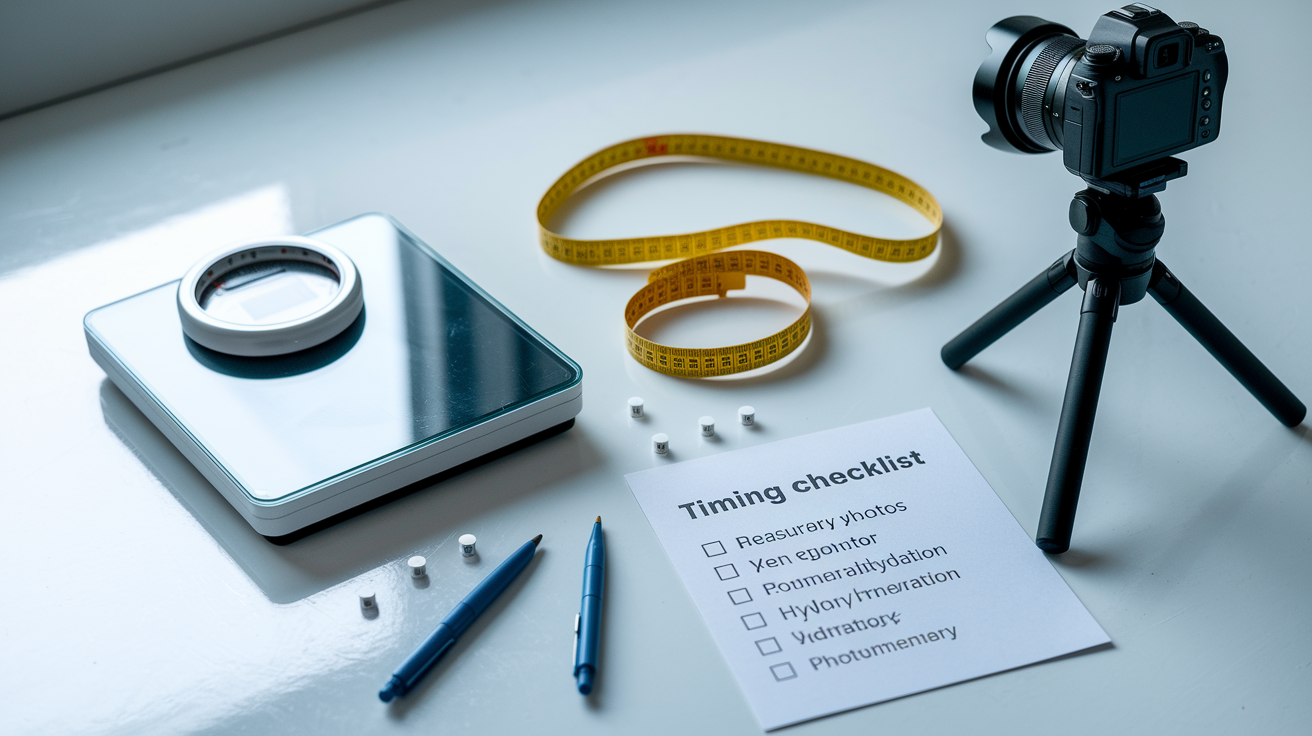
Protocols for Consistent Measurements: Timing, Hydration, and Standardization
Measure your body composition metrics at the same time of day under the same conditions every time. Morning measurements after an overnight fast of at least eight hours give the most stable baseline because food, hydration, and exercise haven’t introduced variables yet. Before you step on the scale or pull out the tape, use the bathroom to empty your bladder and, if possible, defecate. Wear the same minimal clothing or none so fabric weight and thickness don’t shift the numbers. Small details like these reduce measurement noise and let real changes stand out.
Avoid exercise for at least twenty four hours before a measurement session, especially high intensity lifting or long cardio. Training shifts blood flow, increases muscle glycogen and water storage, and can temporarily inflate muscle size and body weight by several pounds. Similarly, keep hydration consistent by drinking your usual daily water intake the day before and then fasting overnight. Don’t chug extra water or intentionally dehydrate. Both will distort BIA readings and even affect circumference measurements slightly due to fluid shifts under the skin.
Use the same equipment and setup for every measurement. Weigh yourself on the same scale in the same spot on your floor. Hard, level surfaces give the most consistent readings. Measure circumferences with the same tape measure at anatomical landmarks you can find reliably, like the navel for waist or the widest part of your glutes for hips. Mark those spots with a washable pen if it helps. For photos, place your phone on the same stand at the same distance and height, use the same room and lighting, and wear identical clothing. Standardization turns noisy data into clear trends.
Checklist for reducing measurement error and improving reliability:
Time of day. Measure in the morning within the same one hour window. Fasted state preferred.
Hydration. Maintain normal daily water intake the day before. Fast overnight. Avoid excess fluids or dehydration.
Food and exercise. No food for at least eight hours. No training for twenty four hours before measurement.
Bathroom. Void bladder and defecate immediately before weighing or measuring.
Clothing. Wear the same minimal outfit or measure nude. Remove shoes, watches, and jewelry.
Equipment and location. Use the same scale, tape, and measurement sites. Mark anatomical landmarks. Use identical photo setup with fixed lighting and distance.
Interpreting Body Composition Trends While Lifting: Muscle Gain, Fat Loss, and Recomposition
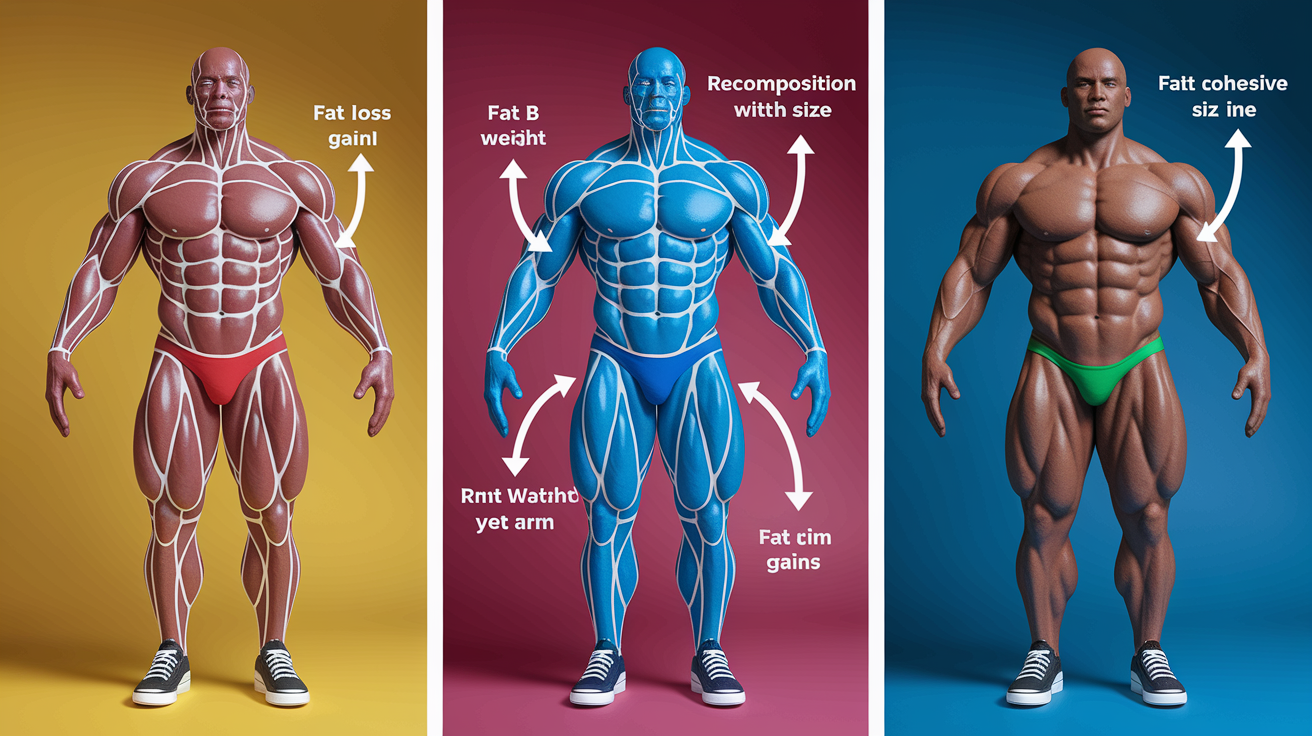
Body composition changes reveal themselves through patterns across multiple metrics, not single data points. If your body weight drops, your waist and hip circumferences shrink, and your strength on key lifts holds steady or climbs, you’re losing fat while preserving or gaining muscle. That combination confirms a successful caloric deficit with adequate protein and smart training. If your weight stays flat but your waist decreases and your upper arm or thigh circumference increases while your lifts improve, you’re in recomposition. Building muscle and losing fat simultaneously, which is common for newer lifters or those returning after a break.
When body weight and most circumferences rise together, you’re in a caloric surplus. That surplus could be building muscle if your strength is climbing and your arms and legs are growing faster than your waist. If your waist is growing as fast as your limbs and strength gains plateau, the extra calories are likely converting to fat and you should dial back intake slightly. DEXA or BIA body fat percentage changes smaller than one to two percent may just be measurement noise, especially with at home scales. Trust circumference trends and performance improvements more than small percentage swings.
Three example interpretation rules to guide adjustments:
Fat loss with muscle preservation. Body weight ↓, waist circumference ↓, strength stable or rising. Caloric deficit is working. Protein and training volume are adequate. Continue current plan.
Recomposition. Body weight stable, waist circumference ↓, arm or thigh circumference ↑, strength ↑. Muscle gain offsetting fat loss. Common in newer lifters. Maintain current calories and training intensity.
Surplus with unclear partitioning. Body weight ↑, waist and limb circumferences both ↑. Net caloric surplus. Check if strength gains justify the rate of weight gain. Reduce calories slightly if waist is rising faster than performance.
Recommended Tracking Frequency and Weekly/Monthly Schedule for Lifters

Daily body weight tracking is fine if you average the numbers by week and don’t react to single day spikes. Weigh yourself every morning under the same fasted conditions, then calculate the weekly average. That smooths out water retention, glycogen shifts, and meal timing effects. Weekly averages reveal real trends. Daily weights mostly reveal noise. For circumference measurements, once per week or every two weeks is enough because muscle and fat changes happen slowly. Measure on the same day of the week at the same time to keep conditions consistent.
Progress photos every two to four weeks capture visual changes without overwhelming you with comparisons. Take the shots on the same day you measure circumferences so the data aligns. Strength metrics belong in your training log after every workout. Record working weights, reps, and sets so you can spot performance trends across weeks. A full body composition test using DEXA, Bod Pod, or hydrostatic weighing every eight to twelve weeks provides a high accuracy benchmark that validates or corrects the signals from your at home tools.
| Metric | Frequency |
|---|---|
| Body weight (scale) | Daily, calculate weekly average |
| Tape circumferences (waist, hips, arm, thigh) | Weekly or every two weeks |
| Progress photos (front, side, back) | Every 2–4 weeks |
| Strength log (weights, reps, sets) | Every training session |
| Full body composition test (DEXA/Bod Pod/Hydrostatic) | Every 8–12 weeks |
Final Words
Start with baseline numbers: weigh-in, a few tape sites, and a setup for progress photos. Combine at least two methods—scale plus tape or scale plus photos—and keep a simple strength log.
Retest around every 6 weeks, use weekly averages to smooth daily swings, and measure under the same conditions each time.
If you want clear answers on how to track body composition while lifting weights, follow this routine, stay consistent, and celebrate the small, measurable wins.
FAQ
Q: What is the 3 3 3 rule for weight lifting?
A: The 3 3 3 rule for weight lifting is a strength-focused plan: three sets of three reps with heavy loads to build strength. Add weight once you complete all 3×3 reps with good form.
Q: What does 20% body fat really look like?
A: The 20% body fat looks like a soft midsection without visible abs in most men, with muscle shape still visible; women usually appear athletic with some fat on hips and thighs.
Q: Does 10 lbs of fat look like 10 lbs of muscle?
A: Ten pounds of fat looks larger and softer than ten pounds of muscle because fat is less dense; muscle appears smaller, firmer, and more compact even though the weight is the same.
Q: Is 73% muscle mass good?
A: A 73% muscle mass is unusually high and likely a measurement or definition issue; most people’s skeletal muscle percent is much lower. Check what the device actually reports and compare to norms.